Dashboard Day 5
For the 5th day of Dashboard Week we were tasked with accessing a kaggle database set of survey data from an American study that looked at mental health disorders and music.
I was curious about whether the music preferences of those with high self reported rates of mental health would differ from the wider population.
Here’s how I approached the challenge.
Alteryx
The first step was to find data from the wider population so I could compare the two.
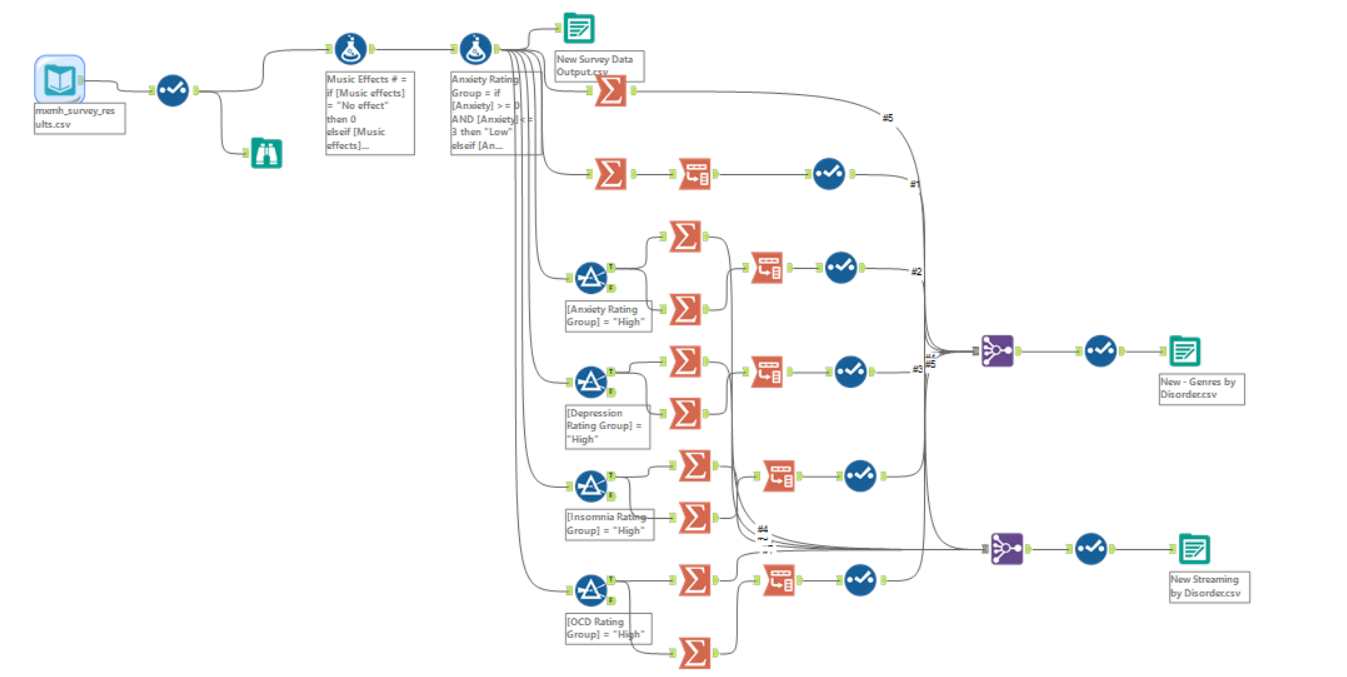
I did so from two sources regarding the streaming platform and most popular genres.
This produced a few outputs that I could then access in Tableau.
Here’s an overview of the screenshot:
Tableau
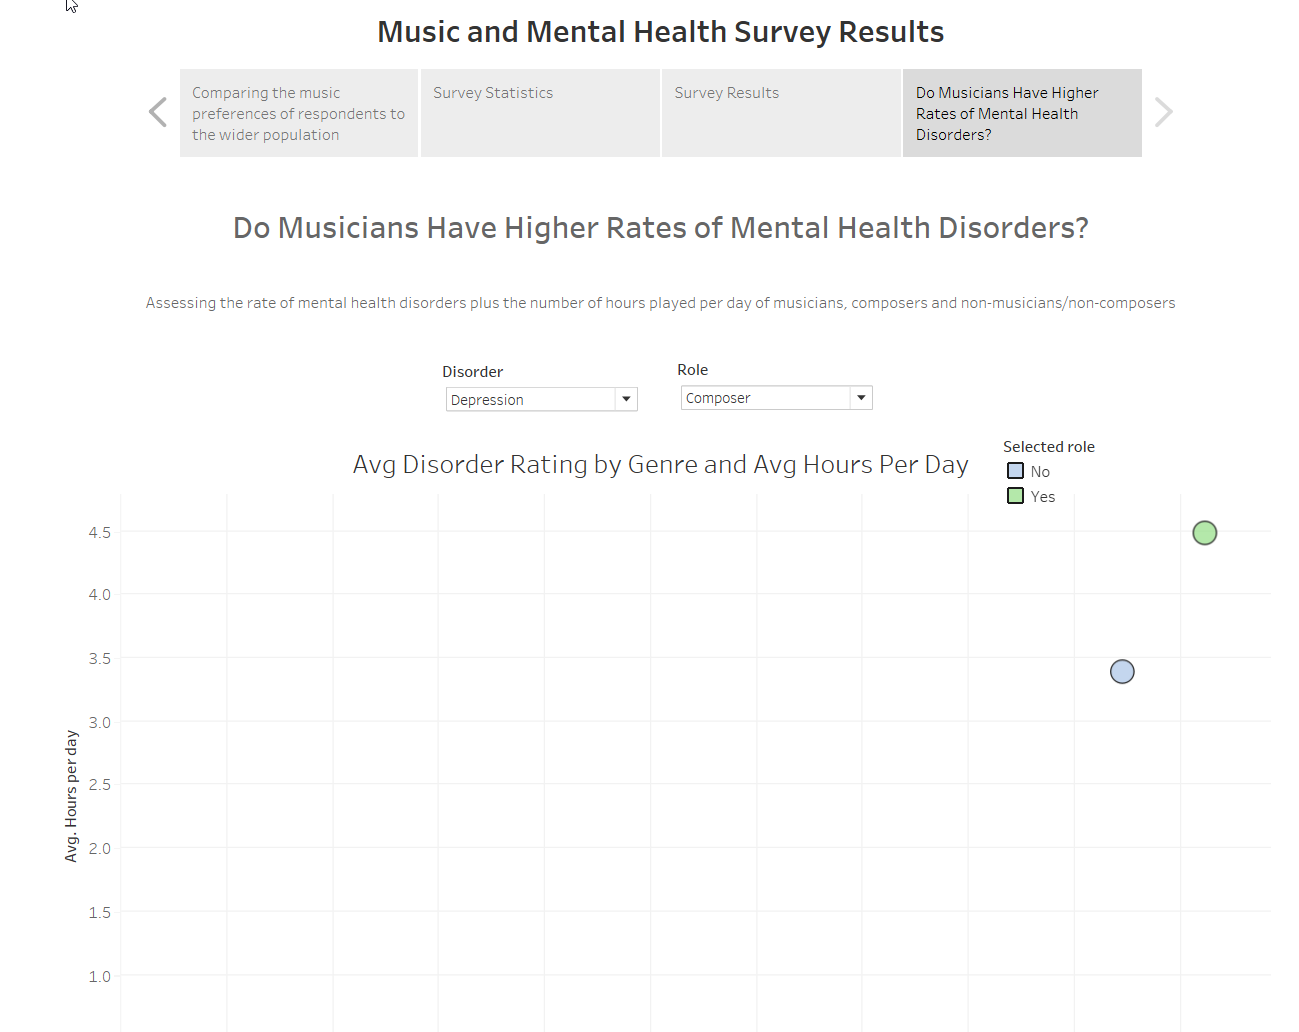
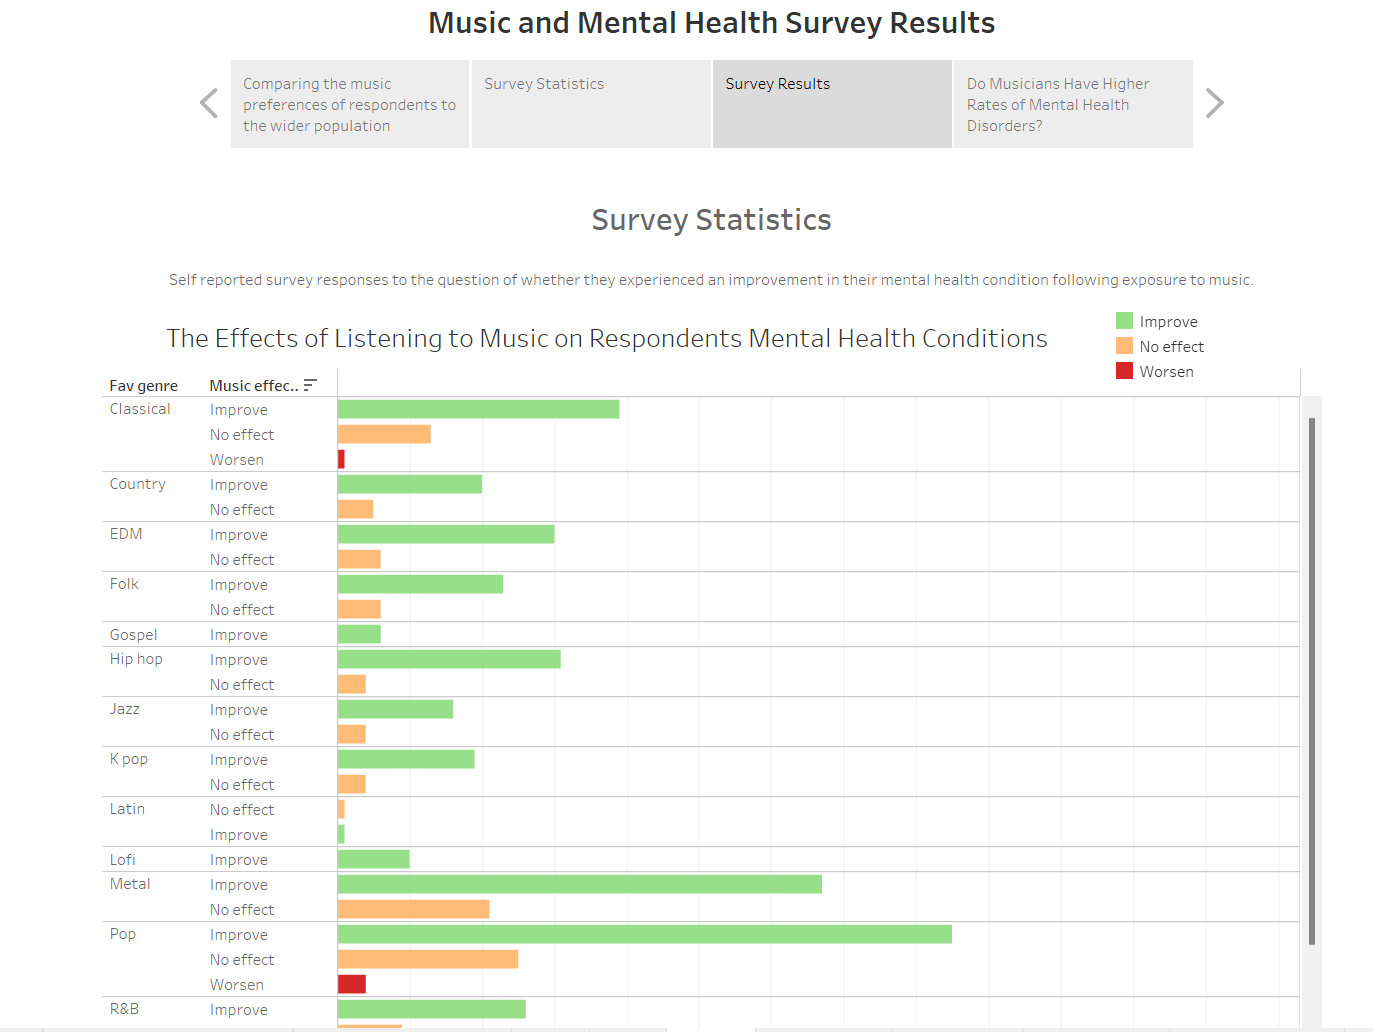
After working on the data it was time to build the dashboard. I decided to use a story format as I’ve never done so before and had seen a few interesting use cases on Tableau public.