

Julian Garcia Quevedo
Julian studied Business Management in Argentina. After working as a Financial Analyst for a couple of years, he decided to pursue his dream of being an entrepreneur and created a football fields rental business, and later established his craft beer bar chain.
After some years, he decided to move to Australia and became a Kitesurf Instructor in Sydney. Through his time as a financial analyst and entrepreneur, he developed his passion for data and wanted to continue growing his analytical skills, which led him to join The Data School.
In his spare time, he enjoys kitesurfing, sailing, and going camping with friends.


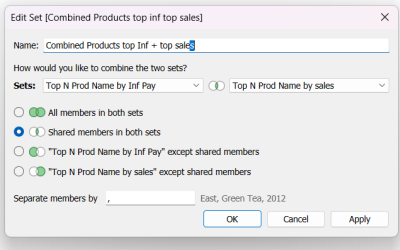
Using Combined Sets to analyze data
Combined Sets to Analyze data On last week project we had to analyze a fake brand data. I needed to see some insights about which products were benefiting the most by paying social media influencers to endorse their products. The data I was using had a lot of fields...
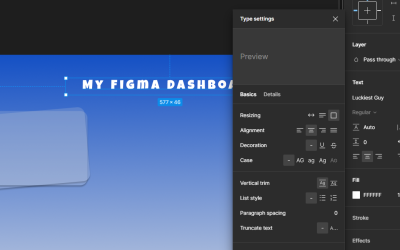
Style your dashboards with Figma
Style your Dashboard with Figma Hi all, during our Data School training we were shown a great tool to give some style to our dashboards, Figma.com. With Figma you can make your dashboards look way nicer. Create backgrounds to each chart or container, creating a...
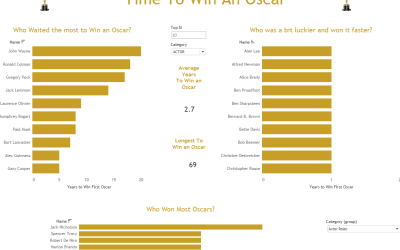
Dashboard Week Day 5: Time to Win an Oscar
Hi everyone , last Dashboard of Dashboard week. This time Tableau again. We were given 2 datasets containing information of all the Oscar's Academy Awards, to build a Dashboard in record time. My goal was to know how long it takes a nominee to get an Oscar after not...
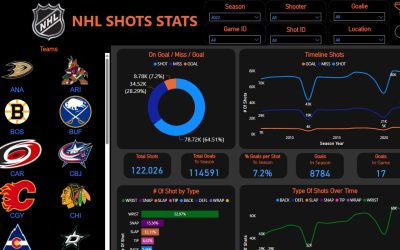
Dashboard Week Day 4: Ice Hockey Shots Stats
NHL Type of Shots Stats Hi everyone, today I'm posting my 2nd PowerBI report of Dashboard week. We were able to download datasets from MoneyPuck.com -Download Data containing tons of data since 2007. I decided to download every single shot data recorded since. There...
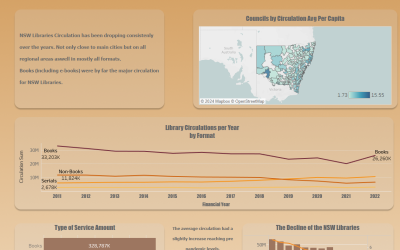
Dashboard Week Day 3: NSW Libraries Circulations by Format
Hi Everyone, as part of Dashboard week we were given the option to choose a topic from the datasets of NSW Libraries. NSW Libraries have recorded data from 2011 ready to download. My goal was to analyze the performance of different formats over the years, as well as...
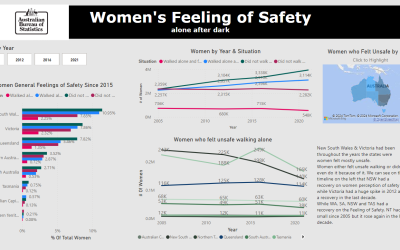
Dashboard Week Day 2: Australia’s Feeling of Safety
Hi Everyone, as part of Dashboard week we were given the option to choose a topic from Australian Crime Statistics. The Australian Bureau of Statistics has a huge amount of data to download on all types of Crime & Justice topics. To start I downloaded all the data...
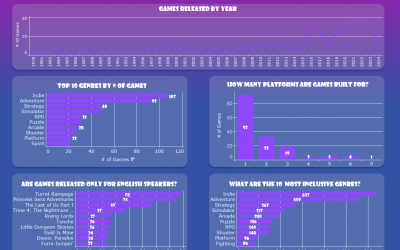
Dashboard Week Day 1: Video Games – Twitch API
Hi everyone! In today's blog I'll be showing you my first dashboard of the week. We had to connect to the Twitch API in Alteryx and build a Dashboard in Tableau So first I created an account in Twitch and from there get the Token to connect to the API in Alteryx. In...

LOD Expressions – The Basics
Why should I know LOD expressions? Level Of Detail Expressions allow you to compute calculations at the aggregation level you want. In your worksheets you generally create calculations at the visualization level of detail (by dropping measures or dimension in...

PowerBI: How to use a Top N Parameter to filter your chart
How to filter your chart with a Top N Numeric Parameter Hi everyone! In today's blog I'll show you how to add a Numeric Range Parameter to filter Top N Values in your charts. We will need to create a few calculations in order to achieve this. For this Bar chart...

My way to get the Alteryx Designer Core Certification
Hi there! At DSAU24 we all just got our Alteryx Designer Core Certification with only a couple of days using Alteryx. My goal with today's blog is to help you gather resources to study, practice, and also facilitate cheat sheets that may come in handy during your open...