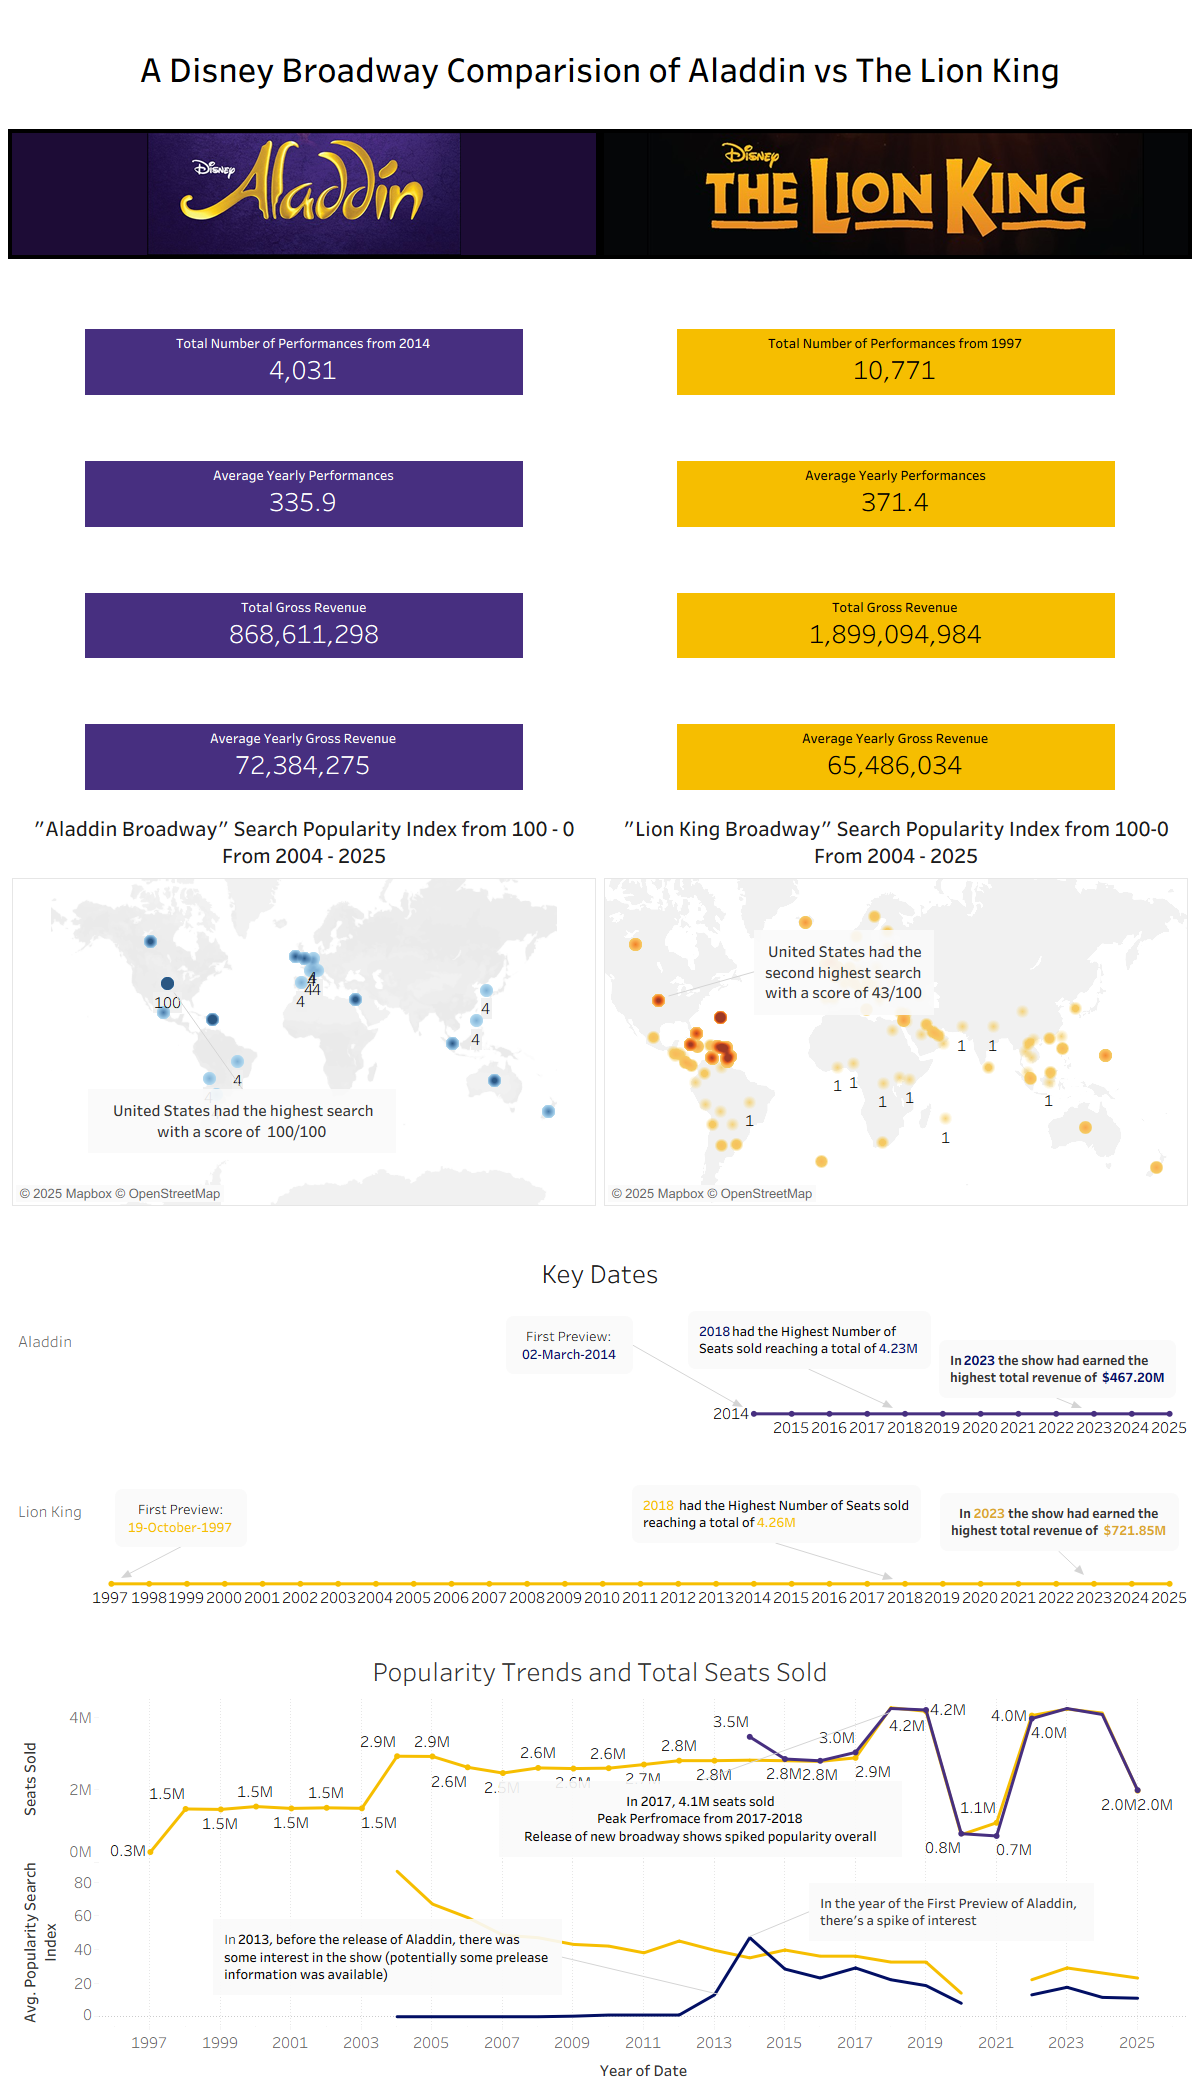
For this dashboard week, the first challenge we received was a task to build a comprehensive dashboard which would utilise the Playbill Internet Broadway database – specifically on tableau. It was daunting at first; but – like always – when faced with a task of such a broad spectrum we must break it down into manageable pieces.
Choosing Data
However, that is not always the simplest task even if it is the most significant. In consideration that the topic aligned with Internet Broadway, I was swept with a wave of nostalgia that simply clicked together the pieces of the puzzle. Disney. Without a doubt, this was the franchise that made me reminisce of childhood and brought back memories stored deep within my heart. I could appreciate crafting a dashboard on this topic. This meant that every step of the journey was brimming with fascinating discoveries, inspiring ideas, roaring reveries and it felt like “a whole new world”. So, there was no better choice than Aladdin and The Lion King.
Webscraping with Alteryx
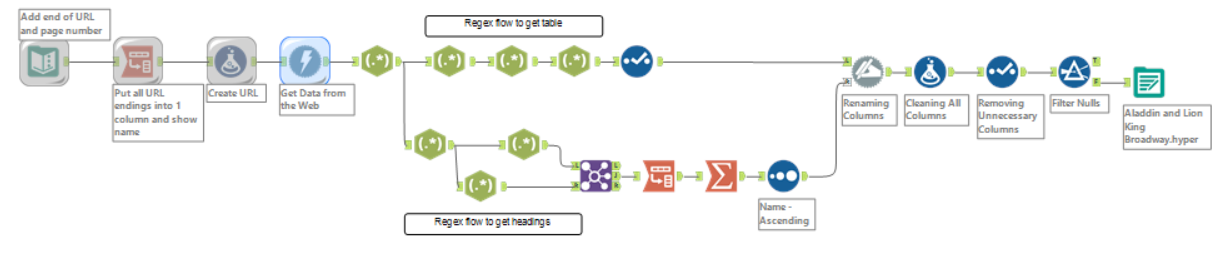
The second hurdle of the task was getting the data itself. Again, I was overwhelmed with the challenge of using Regex; however, I quickly realized that it was no foe of mine. I began simply with extracting one page of the Broadway Grosses for The Lion King and then for Aladdin. This allowed me to get the structure of my Regex and the columns from the tables, especially since the headers required some extra effort to extract. This involved: creating a Regex flow for the body of the table and the headers, doing a transpose, summarize and finally a dynamic rename tool to get the headers of each of the columns.
Once the structure was completed, I wanted to get the entire history of the grosses for all time for both shows. It was a tedious task, but I managed to extract all 20 pages from The Lion King which consisted of data from 1997-2025 and for Aladdin there were only 10 pages, dating from 2013-2025.
The data was extracted.
Yet the task did not end here.
The data was “dirty” and needed cleaning, which I cleaned using a formula tool… and as I write this blog, I realise there may have been an easier way to clean those columns. I should have used a Multi Field Formula tool and not an ordinary Formula tool – that would have saved me a lot of time.
Dashboarding
Once that was complete, I could move on to dashboarding. This was surprisingly where I suddenly had a blocker – something akin to writer’s block – dashboarding block?
I struggled to decipher what “story” I should show. Particularly, given that, we needed to show something that could not already be easily understood or found on Paybill. I began searching for supplementary data to inspire my visualisation. That’s when I stumbled across something interesting. Google Trends – I hadn’t seen or heard of this before. Nonetheless, it seemed to be promising. I put in the search term “Aladdin Broadway” and “Lion King Broadway” and – with some tinkering around – I did find some interesting information that I tried to incorporate into Tableau.
In Summary
Unfortunately, I did not succeed in creating something I would find outstanding. It is definitely not one of my greatest or proudest dashboards, but I hope to improve my time management for tomorrow’s task and I hope to recover in time from my “dashboarding block” so that I can build something far better.
All in all, I did enjoy parts of the challenge and look forward to the next challenge.