Introduction
It’s day 4 for dashboard week. There have been many trials and tribulations to overcome. None that I may forget, yet has reforged my comprehension, enthusiasm and skill set for developing comprehensive dashboards, especially under time sensitive conditions. Despite the difficulties and sleepless nights, or perhaps because of this, I find myself pondering: what are the correlations of crossword puzzles?
What are we doing?
This 2nd last challenge is in Power BI and requires us to use a messy set of data that has been tackled by our coach as she tries to make the data into something usable for us. The data is from century-arcade’s extensive data on crossword puzzles and dating back from pre-1965. Not much to go on.
Indeed, this felt like a very vague challenge and with very little I could personally connect with, which made it increasingly difficult to see what I would do with this data. Connecting the dots was an elusive job.
My Method
I tried to outsource something that could add more clarity to the data and that is when I found the Datamuse API. It required no authentication, so it was simple to use as I just needed to input this into a blank query and invoke a custom column to get Parts of Speech and frequency.
Web.Contents(“https://api.datamuse.com/words“, [
Query = [
sp = Text.Lower(term),//the word
md = “pfd”,//the parameters – p(POS), f(frequency) and r(pronunciation)
max = “1”
],
Headers = [
#”User-Agent” = “Mozilla/5.0”,
Accept = “application/json”
]
])
The f: value is a log-scaled frequency estimate, hence higher numbers = more commonly used words. This was in order for me to find a way to class the difficulty of the crossword, thereby, being able to add another dimension to the data.
Unfortunately, although this API was working it would take too long to run with over 6 million rows of data, and I had to scrap this idea.
As an alternative route to this – taxing – solution, I decided to opt for an improved and well-balanced path. In its place, I inspected my options of what I could do with the clues and answers table. I hoped I might get some insights from this method. Therefore, I grouped by answers and concatenated all the clues, enabling me to scrutinize the types of clues that were related to a single answer; thereby, I could view the various ways that different questions can be posed to obtain a specific word.
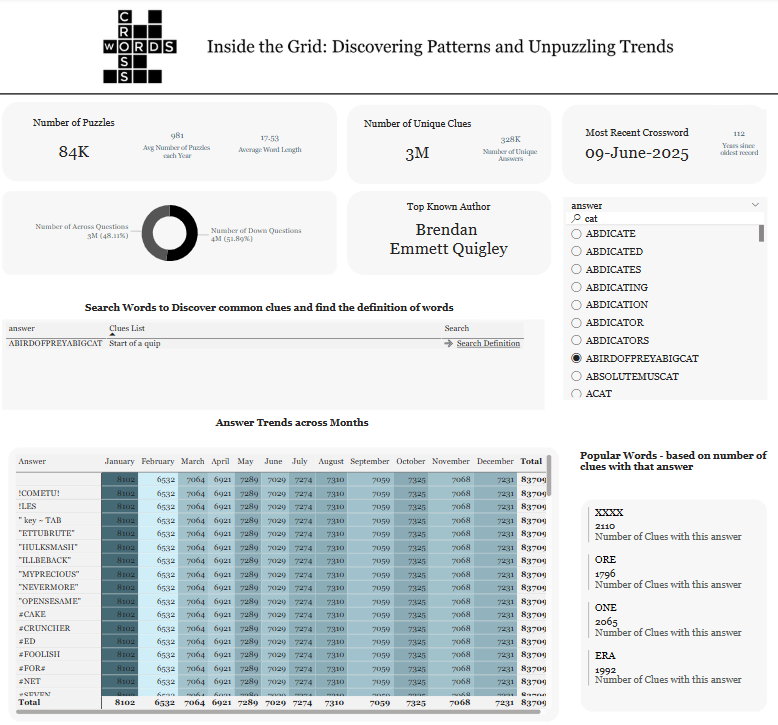
Furthermore, I attempted several other manners of cleaning; however, they did not yield any results. This was because, at the time, the complexity of cleaning certain variations of the text columns was both unnerving and inefficient. Once that was complete, I began working with my dashboard – “Inside the Grid discovering patterns and unpuzzling trends”.
In conclusion
Like all the other dashboard challenges of this week, it was no walk in the park. It was more perplexing than any crossword puzzles ought to let on, nonetheless, it has been an invigorating experience that has built another foundation on myself as a Data Analyst. Despite the long hours I have rooted into the dashboard perfection has not yet grown, nevertheless, it is in these imperfections that underscore the room for improvement and makes me strive to do even better next time. I am glad to have faced this challenge and have put my utmost dedication into this dashboard, although there are still some puzzles unanswered, I am thrilled to see what awaits for my final day of dashboard week.