
by Laszlo Dobiasz | Nov 6, 2019 | Laszlo Dobiasz
On our third day of the dashboard week our task was to create a visualization in Power BI about the disaster of the Titanic. It is a familiar topic for me. This was the data set I chose when I first applied for a placement in the Data School. I was also lucky with...

by Laszlo Dobiasz | Nov 5, 2019 | Laszlo Dobiasz
On the second day of the dashboard week our task was to find and scrape data from the internet about Melbourne Cup and present it in a Tableau Viz. Getting the data I downloaded data from a betting website, cleaned and organized it using regex in Alteryx. It took me a...
by Laszlo Dobiasz | Nov 4, 2019 | Laszlo Dobiasz
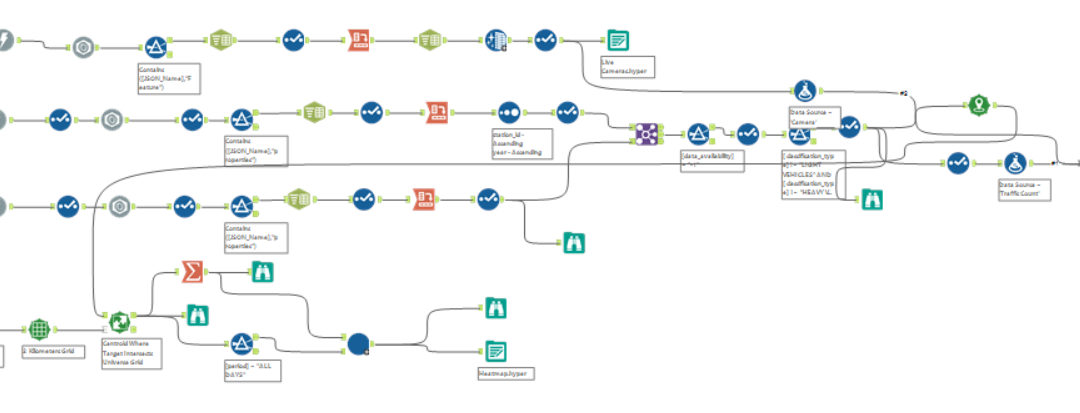
On the 13th week of our training at the Data School we are given a project every day. By the end of each day every one of us have to come up with a visualization and write a blog post about the challenges we faced and the work we done. On Monday Morning we were asked...

by Laszlo Dobiasz | Nov 3, 2019 | Laszlo Dobiasz
In this blog post I will examine what LOD Expressions are, when and how to use them in Tableau. It took me a while to understand how they work and when to use them. The root of the confusion for me was that they happen behind the scenes. This post is for you if you...

by Laszlo Dobiasz | Oct 30, 2019 | Laszlo Dobiasz
If you are scared to present, be assured you are not alone. I also have good news for you. It can be changed or at least improved. I used to be frightened by the idea of presenting in front of an audience too. Here I will share a few tricks with you that I learnt at...

by Laszlo Dobiasz | Sep 20, 2019 | Laszlo Dobiasz
After 4 weeks of intensive training in Tableau and Alteryx, we started our first client project on the 5th Monday. Client projects are great opportunities to work with real data on real business problems, delivering solutions within short period of time using agile...
