

The Challenge
We are almost there! The day 4 challenge is quite interesting. We got a bunch of datasets for solar systems, which varies from individual systems to power stations. The requirements are challenging because we need to add external data to our chosen datasets and blend the data together only using the Tableau product suite. So my best friend Alteryx is out.

The Data
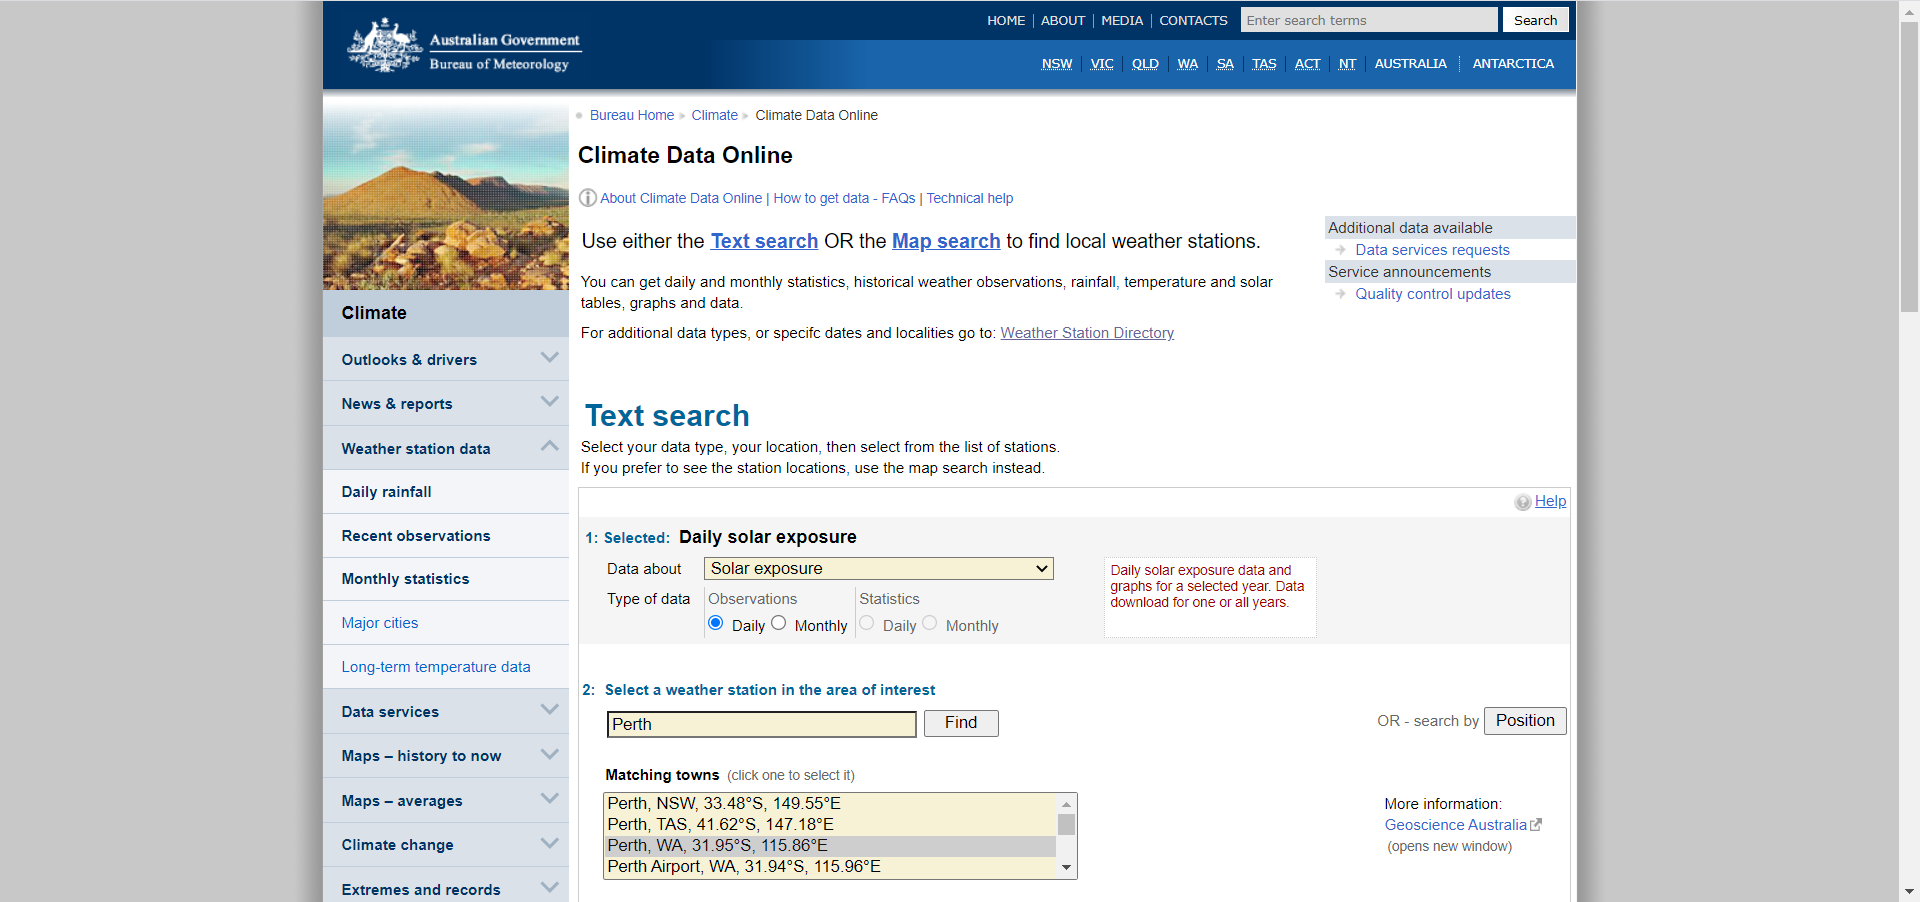
I focused on the individual system and used small scale installations as a reference dataset, then I download three climate datasets from the Bureau of Meteorology as external data.
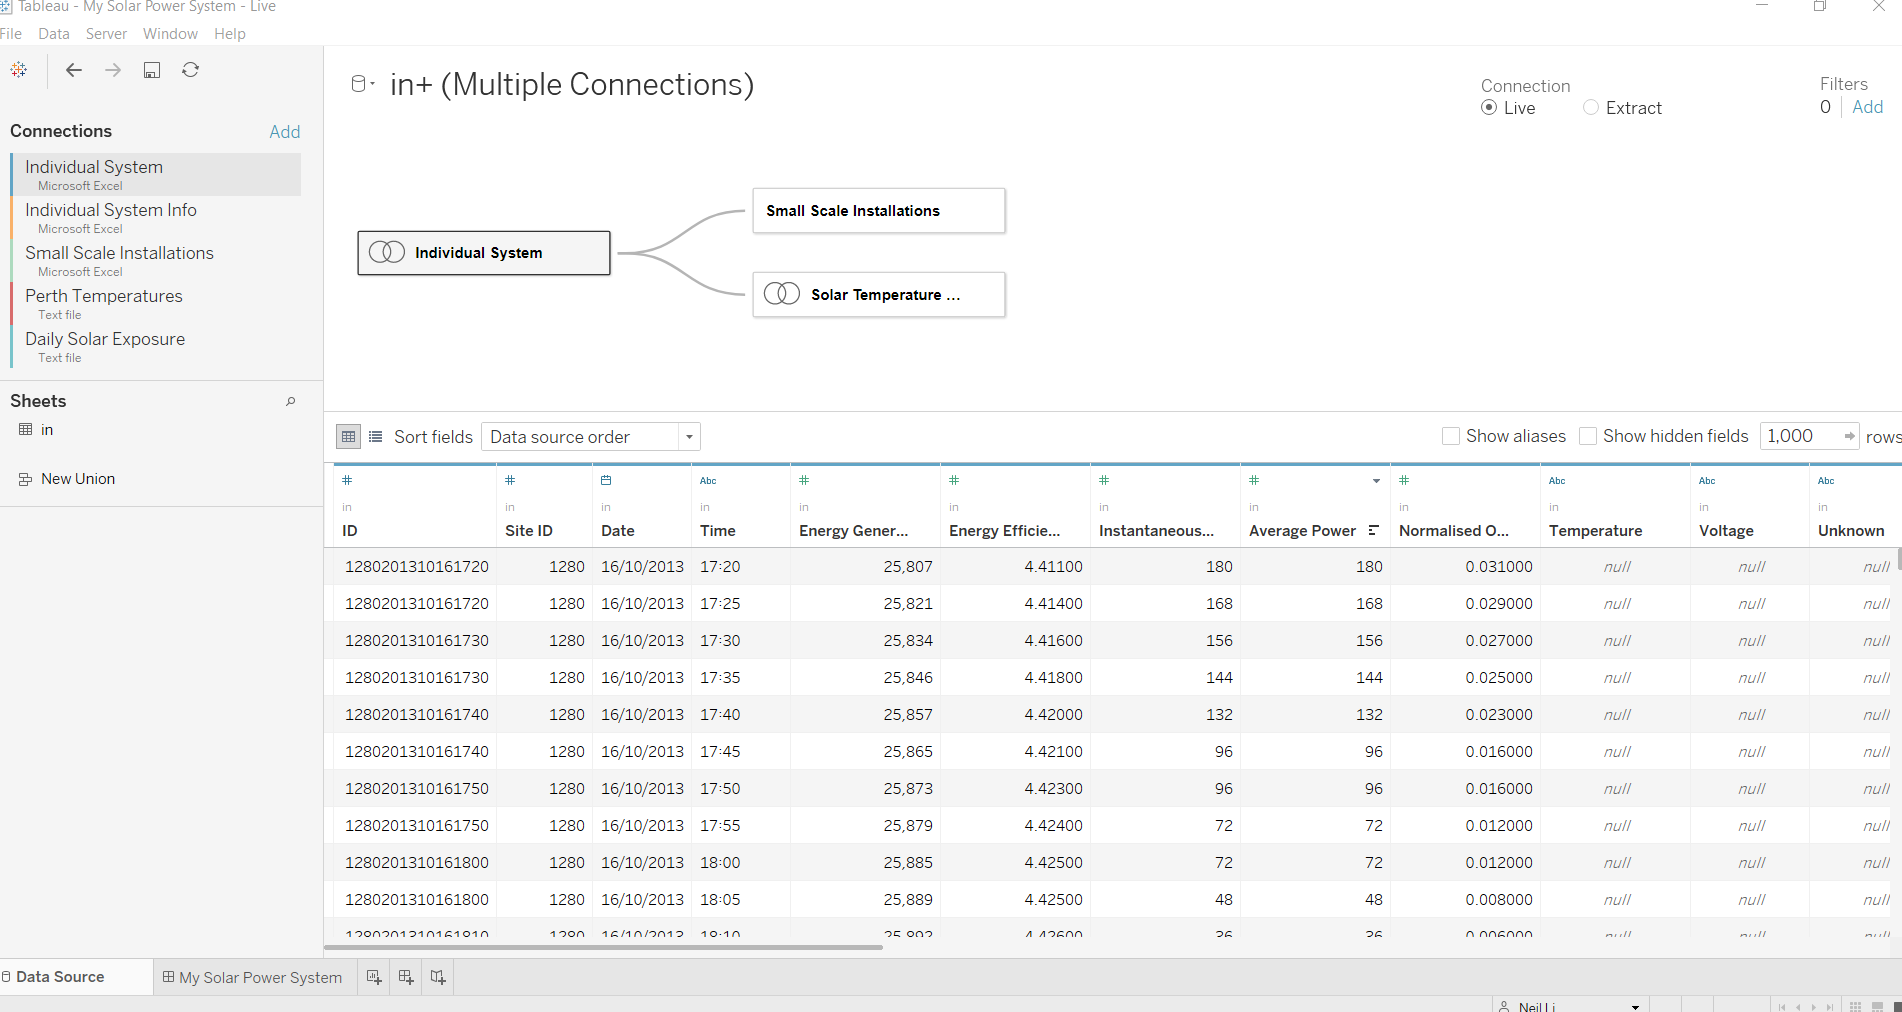
Then I decided to only use Tableau Desktop to do all the data cleansing and blending. Long story short, with lots of trial and error, I nailed it. One tip for you, be careful with the Relationship Calculation, it affect the performance a lot.
The Story
This time I build the story in the first-person narrative. I named my story/viz My Solar Power System. I started by asking questions, like what’s my system efficiency along time? How’s the weather affect it? How about comparing it with my neighbourhood? What is the return period after I installed a new solar system? With these questions in mind, I tried a lot of charts and only kept the most simple and efficient ones.
Because of the dashboard size, I can only present a part of my viz here.

The final viz can be found here.
What went well
- Managed to find weather data without using API
- Managed to do data preparation all in Tableau Desktop
- Add some design into the viz
What could be better
- Timeboxing. Whenever there are new challenges that I haven’t met before, it’s hard to manage the time

Author: Neil Li
Neil graduated from the University of Melbourne with a Master's degree in Information Technology. He started his career as Data Analyst in a Tech Company in China. Recently, Neil moved back to Australia and decided to join The Data School, kick-starting his career with Data Analytics in Down Under. He looks forward to learning cutting-edge skills and meeting fellow data enthusiasts who share a similar passion for data. In his man cave, you will spot Neil enjoying his video games and reading. He steps out with his racquets to swing it for Tennis and Badminton. Want to put a smile on his face? Ask him about the Chinese Hot Pot!