

Data overview
Another day another dashboard week day Today’s dataset topic is related to dengue fever whereby we have been tasked in finding supplementary data to create a story dashboard on Power BI. The data was very limited, and it was clear why a secondary data source would be needed. It included the countries and total count of cases on a yearly and weekly basis.
The Approach
- Examine the given dataset
- Research about dengue to get ideas of what supplementary data to connect
- Find dataset on chosen topic and ensure the secondary data
- Data cleaning and data modelling
- Visualise data
The plan and detours: Wherefore art thou secondary data source
I decided to focus on the US and use that as my basis to examine the data in general. I was glad to see that it includes a lower granularity of country > State > City. However, when I explored the data further, I could see that almost all the State or City were null. I went back and this time downloaded the entire dataset with all the countries for an overview, this way i could get my brain juices moving around. I sighted the top 5 countries and used this as the basis for my next idea. From additional research I had establish a few very interesting angel to pursue including: (1) vaccination administration data by country or (2) dengue fever symptom data .
As time passed, however, it became abundantly clear that finding a suitable secondary dataset on the above topic was serving to be very difficult. I spent the majority of the day locating the specific data and with so much time dissipating, I decided take another approach with my research by filtering down to a specific country instead. Through my research, I understood that the Philippines underwent a dengue vaccination program in 2016 and that country being the third leading globally with dengue fever based on the given dataset – it was an optimal option. In the end, the selected secondary data I chose came from three different sources and include weather, population, death toll data associated to the disease.
Cleaning
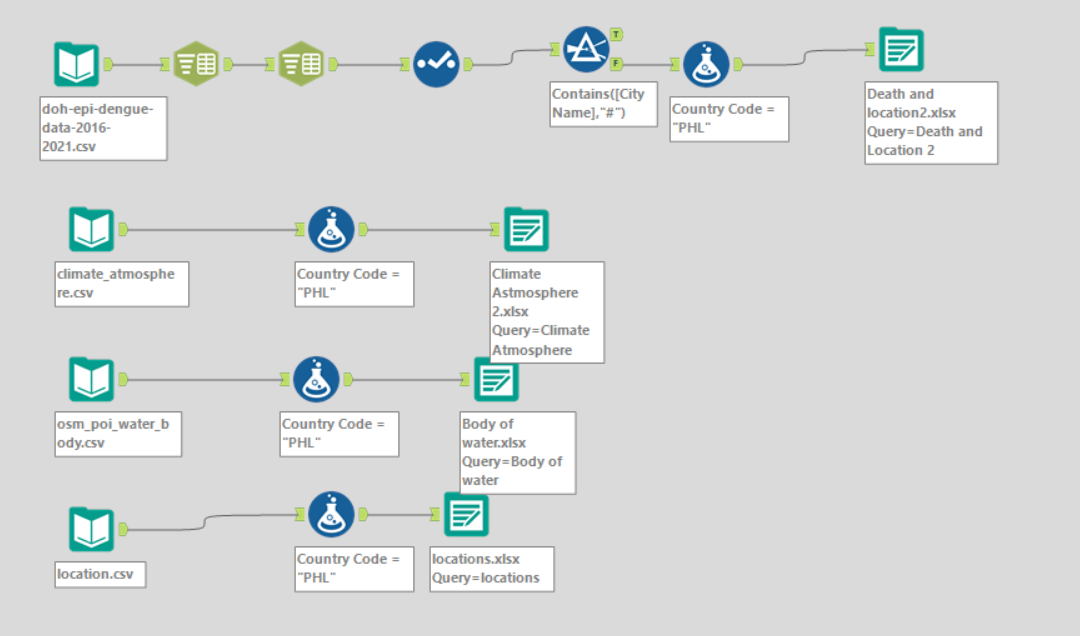
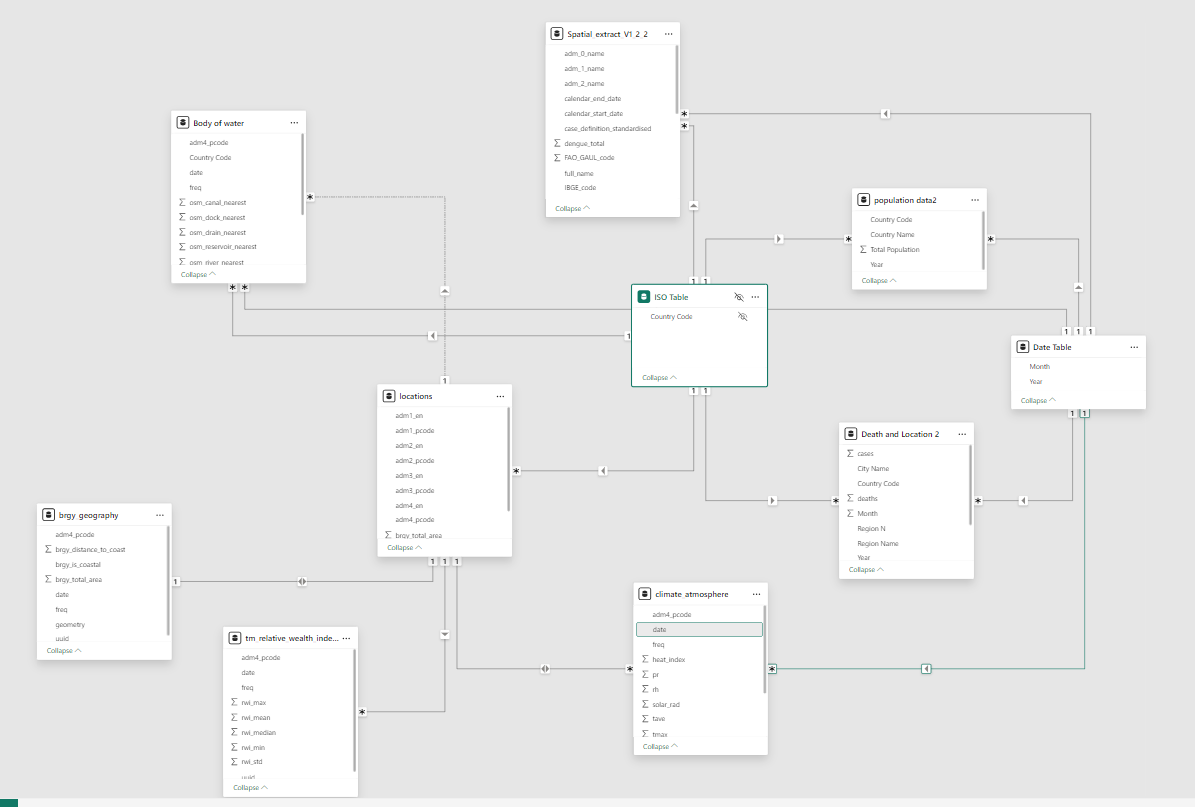
A lot of the data required cleaning and transformation in Alteryx and Power query so I was able to connect the data cohesively. See below the Alteryx workflow and schema.
Final thoughts
Although nothing went to plan, my time boxing went out the window, and tactically adjusted were needed , I did manage to finalise a MVP. I definitely overcomplicated things as I always do, but I have to say, overall today’s challenge served to be a great learning experience regarding optimising data load (both power BI and alteryx crashed on me) and knowledge application.
