


-
Alex Taylor-Jackson
Posts

Dashboard Week Day 4 – U.S Consumption Expenditure
Introduction Today for dashboard week we had the task of making a visualisation of American consumption. The Dataset was used in the application process for...

Dashboard Week Day 3 – Kickstarter Data and Dumbbell Charts
Introduction: For today in dashboard week, our task was to use a Kaggle dataset to do with Kickstarter data. This task came with a caveat,...

Dashboard Week, Day 2 – Pirates of the WORLD
Introduction For day 2 of dashboard week, our task was to use the data (that can be found here) on the National Geospatial Information Agency...

Dashboard Week Day 1 – Spotify API – The Red Hot Chili Peppers
Introduction This Week in the Dataschool Down Under, we bean Dashboard week. This involves creating a viz from scratch, using some of the skills we...

Macro and Analytical App Basics
INTRODUCTION For this blog, I wanted to focus on a topic that I am perhaps not so confident with: Macros and Analytic Apps. I will...

Everything Table Calculations
INTRO In this blog, I will be describing all things to do with Table Calculations. The pretence behind this blog is to help with a...

LOD – Fixed, Include, and Exclude
Level of Detail (LOD) For this blog post, I thought I would write about the difference between different levels of detail (LOD). I wanted to...
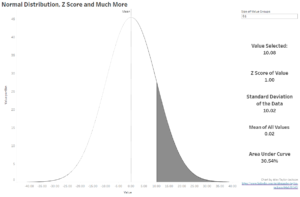
The Normal Distribution and Z Scores
Introduction to Stats A couple of weeks ago in our training at the Data School, we had some lessons on Predictive analysis. The topic of...
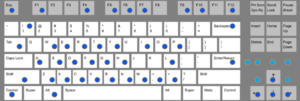
Keyboard Shortcuts in Tableau
Recently I hit the G key by accident on Tableau, to my surprise something happened, gridlines appeared on my screen. This got me thinking what...

Date Parsing in Alteryx and Tableau
Date parsing can be a tricky business in Alteryx and Tableau. To make it easier for myself and others to understand, I decided to write...