


-
The Data School
Posts

A Data Journey into Australian Mining
The mining industry in Australia plays a pivotal role in contributing to the country’s social and economic development. It reflects the evolving needs, demands, and...
3 Crucial Considerations Before Diving into Data Visualization
Data dashboards are like compasses for data analysts and businesses, guiding them to informed decision-making. In a world awash with data, creating a dashboard that’s...

What did it take to get into DSAU23?
DSAU23 are our second Brisbane cohort! Seven individuals were hand-picked out of over a hundred of applicants in this round. In this blog, we will...
Splitting Column into Rows in SQL (MS SQL Server)
This week I have been practising my SQL skills with the Week 2 Case Pizza Run in 8 Week SQL Challenge. In this blog I...
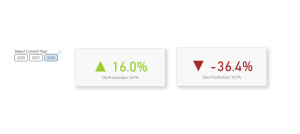
Adding Up and Down Arrows with Color to KPIs in Power BI
As a Tableau user transitioning to Power BI, I found it somewhat challenging to replicate certain features, such as dynamic KPIs with up and down...
How to Calculate Percentage of Total – From Tableau (Table Calc & LOD) to Power BI (DAX)
Both Tableau and Power BI offer powerful calculation capabilities. Tableau emphasizes table calculations and LOD (Level of Details) expressions for interactive visualizations, while Power BI...

Parsing Text with ‘Extract’ Function in Power Query (Power BI)
Shaping data in Power Query, when working within the Power BI ecosystem, is a foundational concept that underpins the process of data transformation and preparation....

Two-Dimensional Control with Slicer
In the realm of analytical panels, space is a premium resource. Thus, optimizing this limited space is crucial, and one effective strategy is to utilize...
3 Ways to Use Regex (Regular Expression) in Alteryx – Empowering Data Transformation and Analysis
Regular Expressions, commonly known as Regex, is a powerful tool that enhances data transformation and analysis capabilities in Alteryx. Regex is a versatile technique that...

What I Learned from Dashboard Week
Dashboard week at The Data School is an intensive and challenging week of creating a new dashboard from scratch on either Tableau or Power BI...