

Alex Chan
Alex has a background in Engineering, having attained a Bachelor’s degree in Renewable Energy Engineering, as well as a PhD for his work on solar cells. He enjoyed analysing research data, but did not want to pursue an academic career. Drawn by the analytic potential of Tableau and Alteryx, he applied to the Data School. In his free time, Alex enjoys playing real-time strategy games and planning his next travel.
Dashboard Week Day 1 : Lessons Learnt in Timeboxing
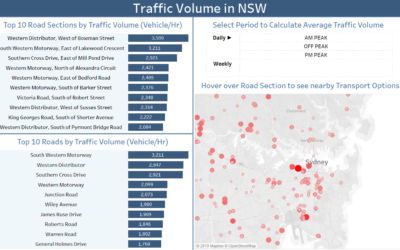
On the first day of Dashboard week, we were tasked with scraping data from the Transport NSW website and finding insights that can be visualised in Tableau. A wide variety of content exists on the website. This includes live road and maritime traffic data as well as...
Using LOD Calculations to “Duplicate” Data
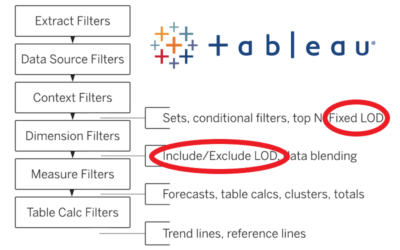
During Teaching Week at Data School AU, we were tasked with preparing for and conducting a teaching session. One of the exercises was based on week 35's Workout Wednesday Challenge by Tableau Zen Master, Rosario Guana. Whilst developing the solution, I...
Basic Workflow Using Predictive Tools in Alteryx
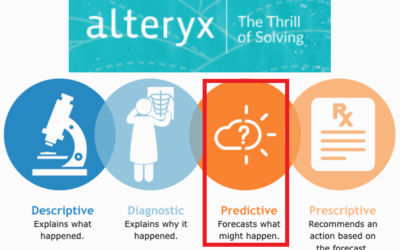
In this blog, I demonstrate a simple Alteryx workflow used for predicting the chance of survival of passengers travelling on the Titanic. Variants of the data set I used can be found on the Kaggle website. However, before I begin with explaining the workflow, it is...
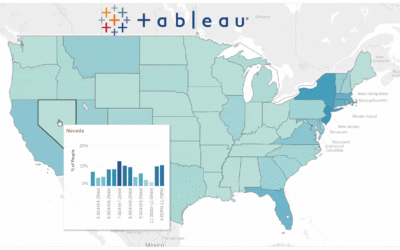
Tableau tips and Viz in Tooltips
Meet & Greet events at the Data School are a great way for prospective applicants to learn more about the work at the School. At the most recent event, I volunteered to demonstrate some of the capabilities of Tableau. The experience was also a chance for me to...

Template for Parsing Data out of HTML or JSON on Websites
In today's blog, I want to briefly summarise a general scheme for parsing data on websites. To do this, I use 2 different templates depending on the website content. Information on websites are generally displayed using HTML or JSON (And sometimes both!). ...
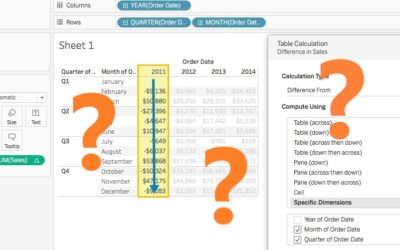
Filtering data using Table Calculations in Tableau
Most Tableau users would know that there are multiple ways to create a desired visualisation. The last 2 weeks of training had introduced me to yet more creative approaches in using Table Calculations and LOD Expression. A big thanks to David and Craig for the...

A Short Guide to Joining the Data School Down Under
Hey guys, I am Alex and this is my first blog post. Week 1 of training at Data School has been very exciting for me. From learning Alteryx for the first time (and regretting the fact that I did not recognise its potential earlier!) to practising for client...