

Alex Taylor-Jackson
Alex has moved to Australia from the beautiful South Coast of England having obtained a degree in Economics in the Netherlands. As a passionate problem solver, Alex is eager to apply his degree in understanding and solving some of the leading challenges in the world using big data, and sharing his insights through data visualisation. In his spare time, Alex enjoys hiking, travelling, swimming and running.
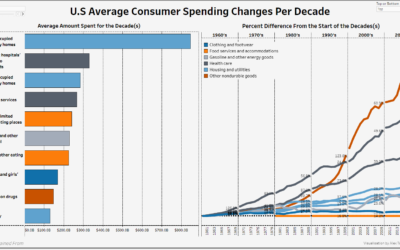
Dashboard Week Day 4 – U.S Consumption Expenditure
Introduction Today for dashboard week we had the task of making a visualisation of American consumption. The Dataset was used in the application process for the next cohort for the Dataschool Down Under. Preparation Opposed to yesterday, we are allowed to use Alteryx...
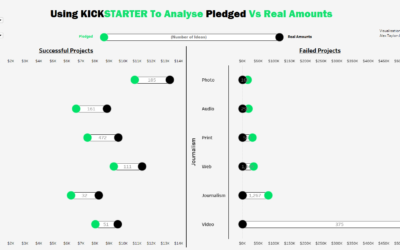
Dashboard Week Day 3 – Kickstarter Data and Dumbbell Charts
Introduction: For today in dashboard week, our task was to use a Kaggle dataset to do with Kickstarter data. This task came with a caveat, we couldn't use Alteryx. We usually use Alteryx to clean and prep data, so without it we used Tableau prep. Luckily for us, the...

Dashboard Week, Day 2 – Pirates of the WORLD
Introduction For day 2 of dashboard week, our task was to use the data (that can be found here) on the National Geospatial Information Agency (NGIA). However, we had to supplement it with data found elsewhere. Originally I wanted to find shipping routes, poverty data,...

Dashboard Week Day 1 – Spotify API – The Red Hot Chili Peppers
Introduction This Week in the Dataschool Down Under, we bean Dashboard week. This involves creating a viz from scratch, using some of the skills we have learnt over our 4 months of training. Plus we only have 1 day to do it! For day 1, we focused on APIs, specifically...

Macro and Analytical App Basics
INTRODUCTION For this blog, I wanted to focus on a topic that I am perhaps not so confident with: Macros and Analytic Apps. I will give an example of each to further my knowledge and the readers. MACROS The premise behind macros is to save time. By this, I mean that...
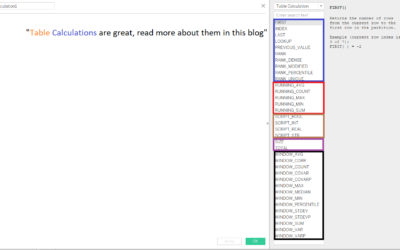
Everything Table Calculations
INTRO In this blog, I will be describing all things to do with Table Calculations. The pretence behind this blog is to help with a teaching session I will give soon about Table Calculations. So, what are Table Calculations? Directly from Tableau help, “Table...

LOD – Fixed, Include, and Exclude
Level of Detail (LOD) For this blog post, I thought I would write about the difference between different levels of detail (LOD). I wanted to do it in as few words as possible as a lot of websites give lengthy explanations and I think the end result is confusion and...

The Normal Distribution and Z Scores
Introduction to Stats A couple of weeks ago in our training at the Data School, we had some lessons on Predictive analysis. The topic of Standard deviations and normal distributions came up, coming from a statistics background I really enjoyed it. But a lot of the...
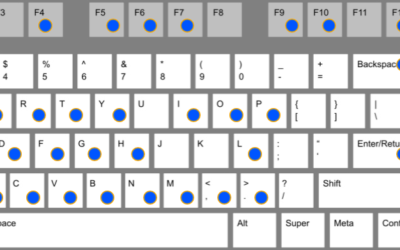
Keyboard Shortcuts in Tableau
Recently I hit the G key by accident on Tableau, to my surprise something happened, gridlines appeared on my screen. This got me thinking what are the Tableau Keyboard shortcuts that people do not know about, and more importantly which are the ones you should know....
Date Parsing in Alteryx and Tableau
Date parsing can be a tricky business in Alteryx and Tableau. To make it easier for myself and others to understand, I decided to write a blog on the topic. Data Parsing is a relatively new topic to the DSAU5 cohort, and we all seem to love it so far. The tricky part...