

Alex Taylor-Jackson
Alex has moved to Australia from the beautiful South Coast of England having obtained a degree in Economics in the Netherlands. As a passionate problem solver, Alex is eager to apply his degree in understanding and solving some of the leading challenges in the world using big data, and sharing his insights through data visualisation. In his spare time, Alex enjoys hiking, travelling, swimming and running.
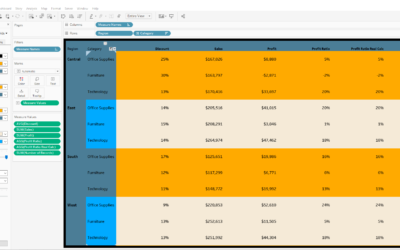
Format Shading Tableau
Inspiration for this post came from doing replications of visualisations from Craig Dewar. Whilst everyone in my cohort could get the final solution, what very few of us could do was to format correctly. One of the issues was shading and how to make the graph/viz...

Data School Team Member Viewer
Intro For this blog post I decided to use the information available to me on the UK and Australian Data School Websites. I wondered how employers and partners of the Data School view and select people to work for them. I decided to make a Viz to make it easier to view...
Autocorrelation in the Alteryx Time Series Tab
What is Autocorrelation? Simply put autocorrelation is a pattern that repeats itself over a time period. Or the degree of similarity of a given time series and the lagged version of itself over a specified time interval. A common example of this is temperature,...

The 5 Different Trend Lines Explained
This blog post was inspired by my cohort not really getting how trend lines are calculated when using Tableau. So I thought I'd brush up on my statistics knowledge and write about it. The five different types of trend lines are: 1.Linear 2.Polynomial 3.Exponential...

Cross Tab and Transpose in Alteryx, with Examples
To try to help my understanding of the difference between the "Cross tab" and "Transpose" tool in Alteryx I wanted to write about it. I believe trying to teach or help others understand what was learnt is the best way to learn yourself. In university, I worked a lot...