

Joe Chan
Joe completed a master’s degree in Information Technology at UNSW, majoring in the AI & Data Science.
He joined The Data School to kick start his career in data analytics as he wanted to dig out the meaningful insights from data to help business grow.
In his own time, he loves playing and watching basketball (a fan of the LA Clippers) and enjoys reading books. His favourite food is Chinese beef noodles.
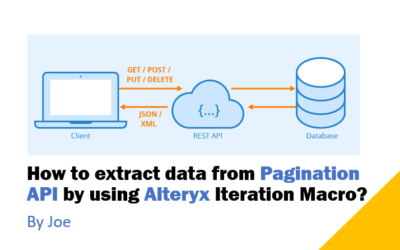
How to extract data from Pagination API by using Alteryx Iteration Macro?
What is API? How to deal with the problem with Pagination API? An application programming interface (API) is a way for two or more computer programs to communicate with each other. Some APIs will provide you with a link to let you collect all the data. In this...
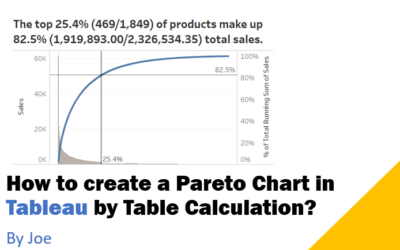
How to create a Pareto Chart in Tableau by Table Calculation?
What is Pareto Chart? A Pareto chart contains columns sorted in descending order and a line representing the cumulative total percentage. It highlights the most significant factors in data and is considered one of the seven basic quality control tools as it's easy to...
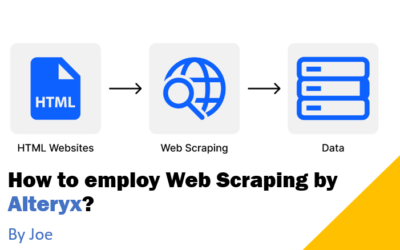
How to employ Web Scraping by Alteryx?
What is Web Scraping? Web scraping is the process of extracting data from a website for the purpose of research, business intelligence, and other operations. Generally, we can get data from the internet to get more information to enable us to make informed decisions....
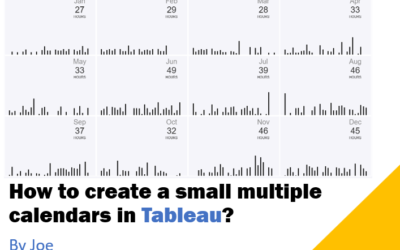
How to create a small multiple calendars in Tableau?
In this blog, I’m going to describe how to create small multiple calendars in Tableau. A small multiple is a data visualization that consists of multiple charts arranged in a grid. This makes it easy to compare the entire data. They are known as the trellis, lattice,...

A solution to Alteryx Weekly Challenge #7 & Insights into the output data
For the first week's training on Alteryx, we were given an Alteryx Weekly Challenge and were required to finish it and present it within 4 hours. If we had additional time, we could create a simple dashboard by Tableau and dig out some interesting insights into the...
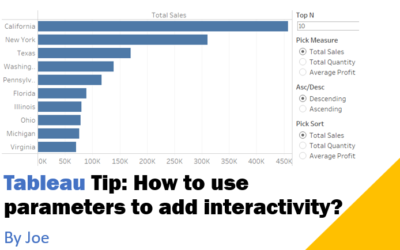
Tableau Tip: How to use parameters to add interactivity?
Sometimes we may want to use one chart to show more insights or add interactivity. You can deal with this issue by creating parameters. I will use the sample superstore dataset to show how to utilize parameters to control different fields' sort, display, and Top N....