by The Data School | Jul 9, 2025 | The Data School
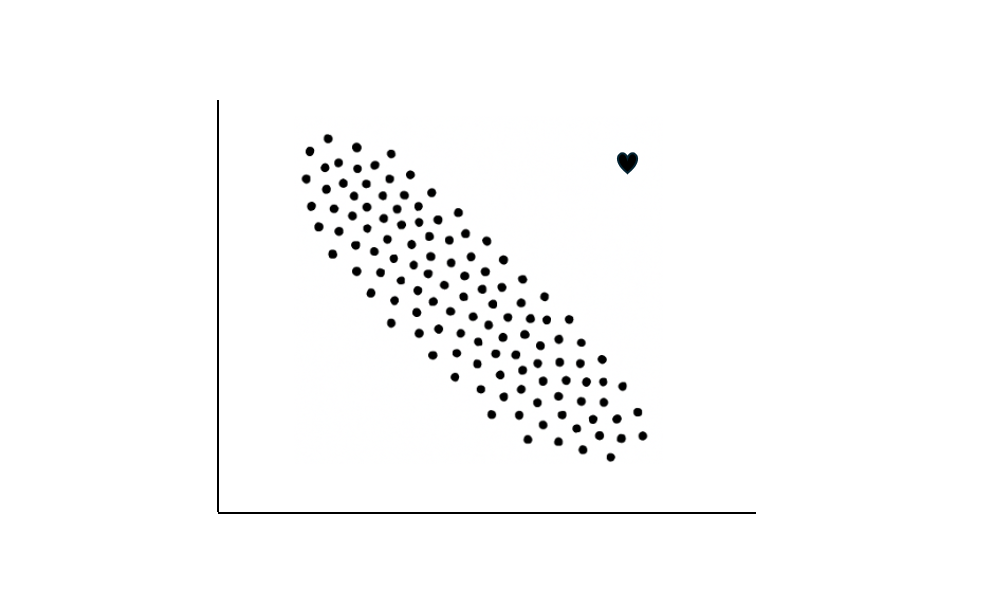
From the “Data but Make it Personal” series – Part 8 When the Data Doesn’t Make Sense (But Matters Most) In every dataset, there are outliers — values that don’t follow the trend, don’t fit the model, don’t behave the way you expect. Analysts are trained to spot them,...

by The Data School | Jul 9, 2025 | The Data School
From the “Data but Make it Personal” series – Part 6 Why good design makes great dashboards possible I love a beautiful dashboard. A clean layout, the right colors, interactive filters, the magic of seeing a story unfold visually — it’s one of the things that...
by The Data School | Jul 7, 2025 | The Data School
Beyond the Rating: The Business of Critically Acclaimed Films When we were handed an 8GB IMDb dataset and told to find a story worth telling, my first reaction was: where do I even start? With a dataset that large, the first challenge was simply making it usable. I...

by The Data School | Jul 7, 2025 | The Data School
Decades of Clues: How Crosswords Reflect Their Times When you think about crosswords, you probably picture a quiet Sunday morning, a cup of coffee, and in my case, i think of my grandpa who used to like them a lot. But crosswords have always been more than just...
by The Data School | Jul 7, 2025 | The Data School
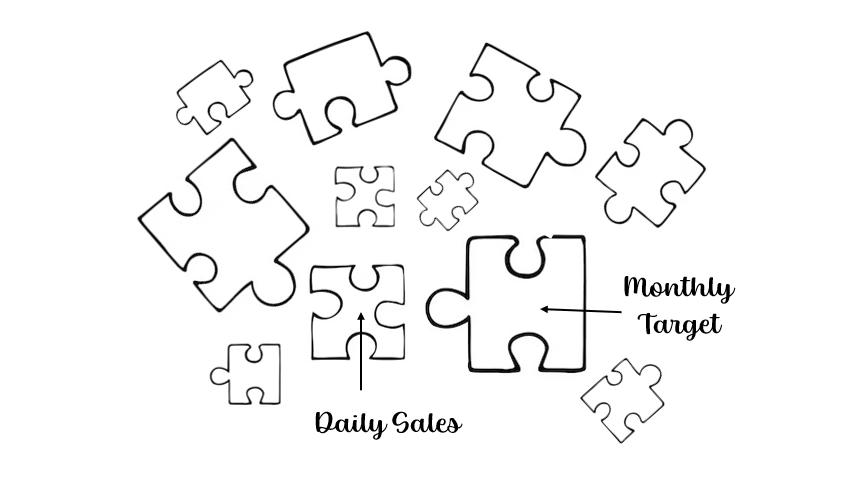
From the “Data but Make it Personal” series – Part 6 When Your Data Level is Sabotaging Your Analysis If you’ve been following this blog series, you know it’s all about connecting data concepts with everyday life. But every now and then, there are topics that...

by The Data School | Jul 3, 2025 | The Data School
Holiday Hazards (2020-2024) A Dashboard Full of Bad Decisions If there’s one thing that American TV does consistently, it’s remind you that holidays are a danger zone. Every Christmas episode has someone falling off a ladder while hanging lights. Thanksgiving?...
