


-
The Data School
Posts

Blog 12 – The 3 Main Differences Between Tableau and Power BI
DSAU22 completed Power BI training recently after spending the majority of our training learning Tableau. There are dozens of differences, from the UI, all the...

Alternative to Power BI’s cards
Introduction Everyone loves big numbers on their reports. After all, it’s an impactful way of getting attention. So it’s reasonable to use Power BI’s Card...

Blog 11 – Dashboard Week Day 4: Spatial and API’s
Dashboard week day 4 kicked off in style, with a spatial and API challenge coming our way. This was going to be an interesting one...

Blog 10 – Dashboard Week Day 3: Victorian Crime Statistics Agency (Power BI)
Dashboard week day 3 was the most difficult challenge yet, not only was the data unfamiliar to the entire team, but it was also in...

Dashboard Week Day 3 – Power BI
Hello and welcome to my dashboard journey 3.0! Unlike the previous two challenges, we were given a set topic this time rather than having...

Dashboard Week Day 2 – Sports
Hey everyone, welcome to my Dashboard Week journey 2.0. Today’s task was to create a cool dashboard about any sport we like. After the journey...

Dashboard Week Day 1 – Web scraping
Today marks the beginning of the Dashboard Week. Our inaugural challenge started with web scraping followed by dashboard creation. But what exactly is web scraping?...
Corporate Social Responsibility Analytics
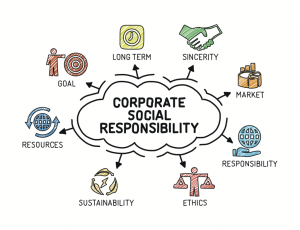
Corporate social responsibility in the supermarket industry involves more than just providing quality products and services. It includes a wide range of initiatives that address...
Dashboard Week Day 4 – APIs and Spatial Challenge
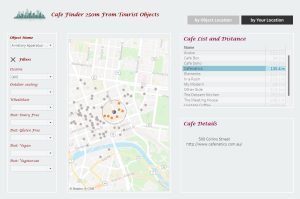
Hello readers! For day 4 dashboard week challenge, we need to use APIs to query the data from the city of Melbourne repository, and create...

The Insights Matrix
On my first day of dashboard week, I ran into the challenge of finding insights from a limited number of fields in my dataset. While...