


-
The Data School
Posts

Dashboard Week Day 3 – Power BI
Day 3 of dashboard week was Power BI day. We were challenged to create a dashboard with a focus on storytelling. We were limited in...
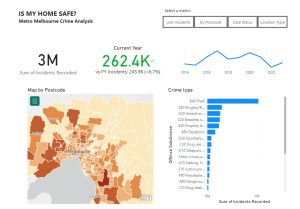
Dashboard Week – Day 3: PowerBI Challenge
Hello again readers! Today’s challenge is to analyse the Victorian crime history, where the data is publicly available here. The twist here is we have...
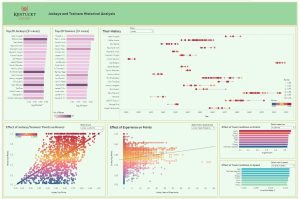
Dashboard Week – Project 2: Sports Day
Hello again dear readers! I finally got the chance to write this blog on day 4 of the dashboard week since I had nasty migraine...

Blog 9 – Dashboard Week Day 2: Sports Day
Dashboard week 2 day was right up my alley; Sports Day. Being an avid sports fan, and having created multiple sports dashboards, I decided to...

3 Tips for Dashboard Development – Dashboard Week Day II
As Day 2 of dashboard week almost come to the end, we have finished our second dashboard – Sports Day, within a limited timeframe. We...

Dashboard Week Day 2 – Sports Day
On the second day of dashboard week, we were tasked with creating a Tableau dashboard using a sports dataset from a list on GitHub. The...

Create Zoomable Charts in Power BI
Introduction Depending on the values in a chart, Power BI may not start the chart’s axes at 0. By default, it will start at the...
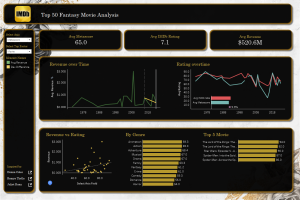
Dashboard Week Day 1
Dataschool training has been intense, but the ultimate challenge is the dashboard week, where we have to produce a dashboard and a blog daily for...
Dashboard Week Day One
Today we have entered Week 14 for our training – three more weeks to go! And this week is our dashboard week, which is a...
Dashboard Week Day 1 – Web Scraping Day
Dashboard Week at The Data School is a week was filled with different data challenges. Armed with tools we have learned such as Tableau, Alteryx...