

Kyle Stanford
Kyle holds a Masters in Teaching, specialising in mathematics and physical education, from WSU. After starting his career as a teacher’s aide and later as a teacher, he shifted to data analytics to explore the world beyond education. With a strong passion for problem-solving, honed communication skills, and an eye for visual design, data analytics has become a natural next step in his career.
Outside of work, Kyle participates in a variety of sports, including martial arts, but also enjoys more relaxed hobbies like gaming, anime, and music.


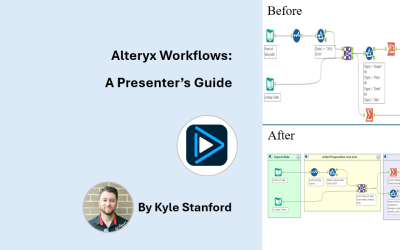
Alteryx Workflows: A Presenter’s Guide
In data analytics, presenting to clients is not always about showcasing magnificent dashboards. Demonstrating how you processed and transformed the data is integral to certain projects. For example, you may be handing over an Alteryx workflow to a client for their...

Dynamic Ranking and Top N for Selected Measures in Power BI
Making your Power BI report dynamic can be both gratifying and painful. Not many things compare to adding a few simple buttons that update all your charts, providing new layers of information that would otherwise be forced into new visuals that clutter your report....
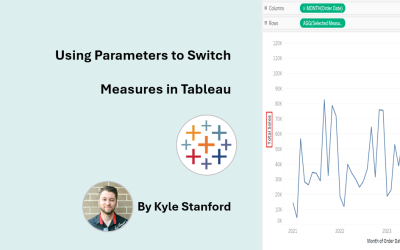
Using Parameters to Switch Measures in Tableau
You’re building a dashboard for a big project. You’ve uncovered dozens of interesting insights that should be shown off, but you don’t want to clutter your dashboard with repetitive bar and line charts. What do you do? Do you get selective with the insights and charts...