
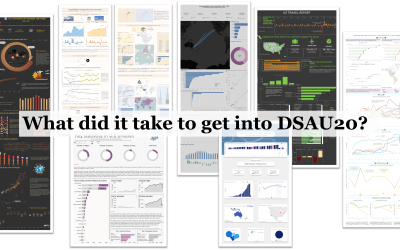
What did it take to get into DSAU20?
The quality of applications to get into the Data School Down Under is getting better and better! For each cohort, I will be compiling the submitted vizzes to show what it takes to get a spot in our program. Let’s take a look at DSAU20’s applications in this blog. For...
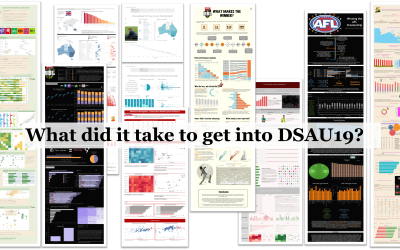
What did it take to get into DSAU19?
The quality of applications to get into the Data School Down Under is getting better and better! For each cohort, I will be compiling the submitted vizzes to show what it takes to get a spot in our program. Let’s take a look at DSAU19’s applications in this blog. For...
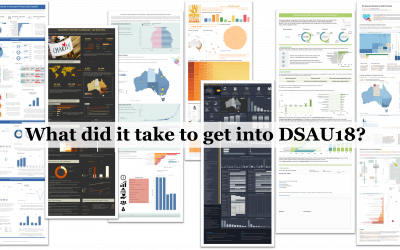
What did it take to get into DSAU18?
The quality of applications to get into the Data School Down Under is getting better and better! For each cohort, I will be compiling the submitted vizzes to show what it takes to get a spot in our program. Let’s take a look at DSAU18’s applications in this blog. For...
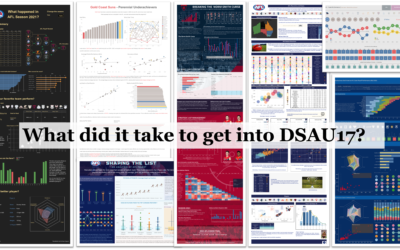
What did it take to get into DSAU17?
The quality of applications to get into the Data School Down Under is getting better and better! For each cohort, I will be compiling the submitted vizzes to show what it takes to get a spot in our program. Let’s take a look at DSAU17’s applications in this blog. For...
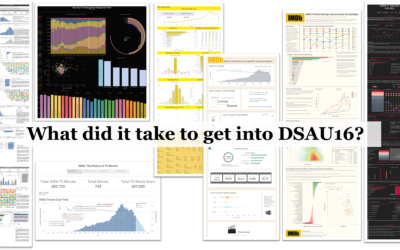
What did it take to get into DSAU16?
The quality of applications to get into the Data School Down Under is getting better and better! For each cohort, I will be compiling the submitted vizzes to show what it takes to get a spot in our program. Let’s take a look at DSAU16’s applications in this blog. For...

What did it take to get into The Data School?
Back in the day, before Unit pricing became mandatory in supermarkets, did you ever find yourself standing in the isle trying to work out if the 375g tub of peanut butter was better value than the 780g tub? If you were like me, you would have done it more times than...

Creating a Dynamic Control Chart in Tableau
Control Charts are typically used to monitor business processes over time, or variations in products or product categories. A control chart always has a central line for the average, an upper line for the upper control limit and a lower line for the lower control...

Creating spatial objects in Alteryx
Alteryx’s ability to generate geospatial polylines provides a way to create and customize a hallmark of spatial analytics. Polylines are a series of two or more spatial points (A fancy way of saying points composed of latitude and longitude!) and depict information...

My experience in the application process and the interviews at the data school down under- Sydney.
My entry into Tableau: One of my friends had some experience in Tableau and told me about it. As I found some interest in it, I started studying Tableau by downloading videos from the Tableau website and started creating some vizzes and slowly became an addicted to...