


-
Don Kang
Posts
Dynamic Title and Highlight with a Set action in Tableau
Dynamic Title and Highlight with a Set action in Tableau In Tableau, one way to make a dashboard dynamic using a selected dimension is through...
Drilldown map in Tableau
Drilldown map in Tableau When working with a map that has multiple data layers in Tableau, it can be challenging to analyze individual measures, especially...
Automating Lists Snapshot using Power Automate: Part 2 – Integration with Power BI
Continued from Part 1 – MS Lists Snapshot using Power Automate In Part 1, we covered how to capture snapshots of Microsoft Lists using Power...
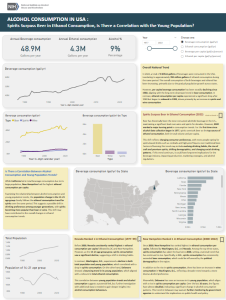
NIAAA Alcohol Consumption in the US
ALCOHOL CONSUMPTION IN USA : Spirits Surpass Beer in Ethanol Consumption, Is There a Correlation with the Young Population? Overall National Trend In 2022,...
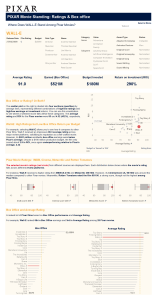
PIXAR Movie Standing: Rating & Box office
This week, I received a dataset containing detailed information about Pixar movies as part of my work at the Data Science (DS) department. My primary...
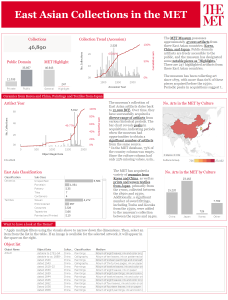
The Metropolitan Museum of Art
The Metropolitan Museum of Art The Metropolitan Museum of Art (The MET) provides a publicly accessible API (MET API). My analysis focused on examining the...
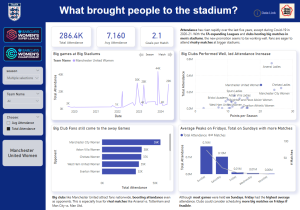
English Women’s Football League Analysis
English Women’s Football League Analysis During our dashboard week with the English Women’s Football (EWF) Database, I focused on analyzing factors driving stadium attendance and...
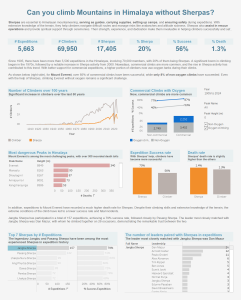
Sherpas in the Himalayas
Can you climb Mountains in the Himalayas without Sherpas? This week at the Data School marked the kickoff of Dashboard Week. Today, I built a...
Automating Lists Snapshot using Power Automate: Part 1 – Snapshot
Automating Lists Snapshot using Power Automate: Part 1 – Snapshot With a database in Microsoft Lists, capturing regular snapshots allows you to track changes over...

Disabling Highlight Action in Tableau
Disabling Highlight Action in Tableau When working with a chart in Tableau, selecting a data point (such as bars, lines, or points) highlights the chosen...